Last checked: 1 November 2026
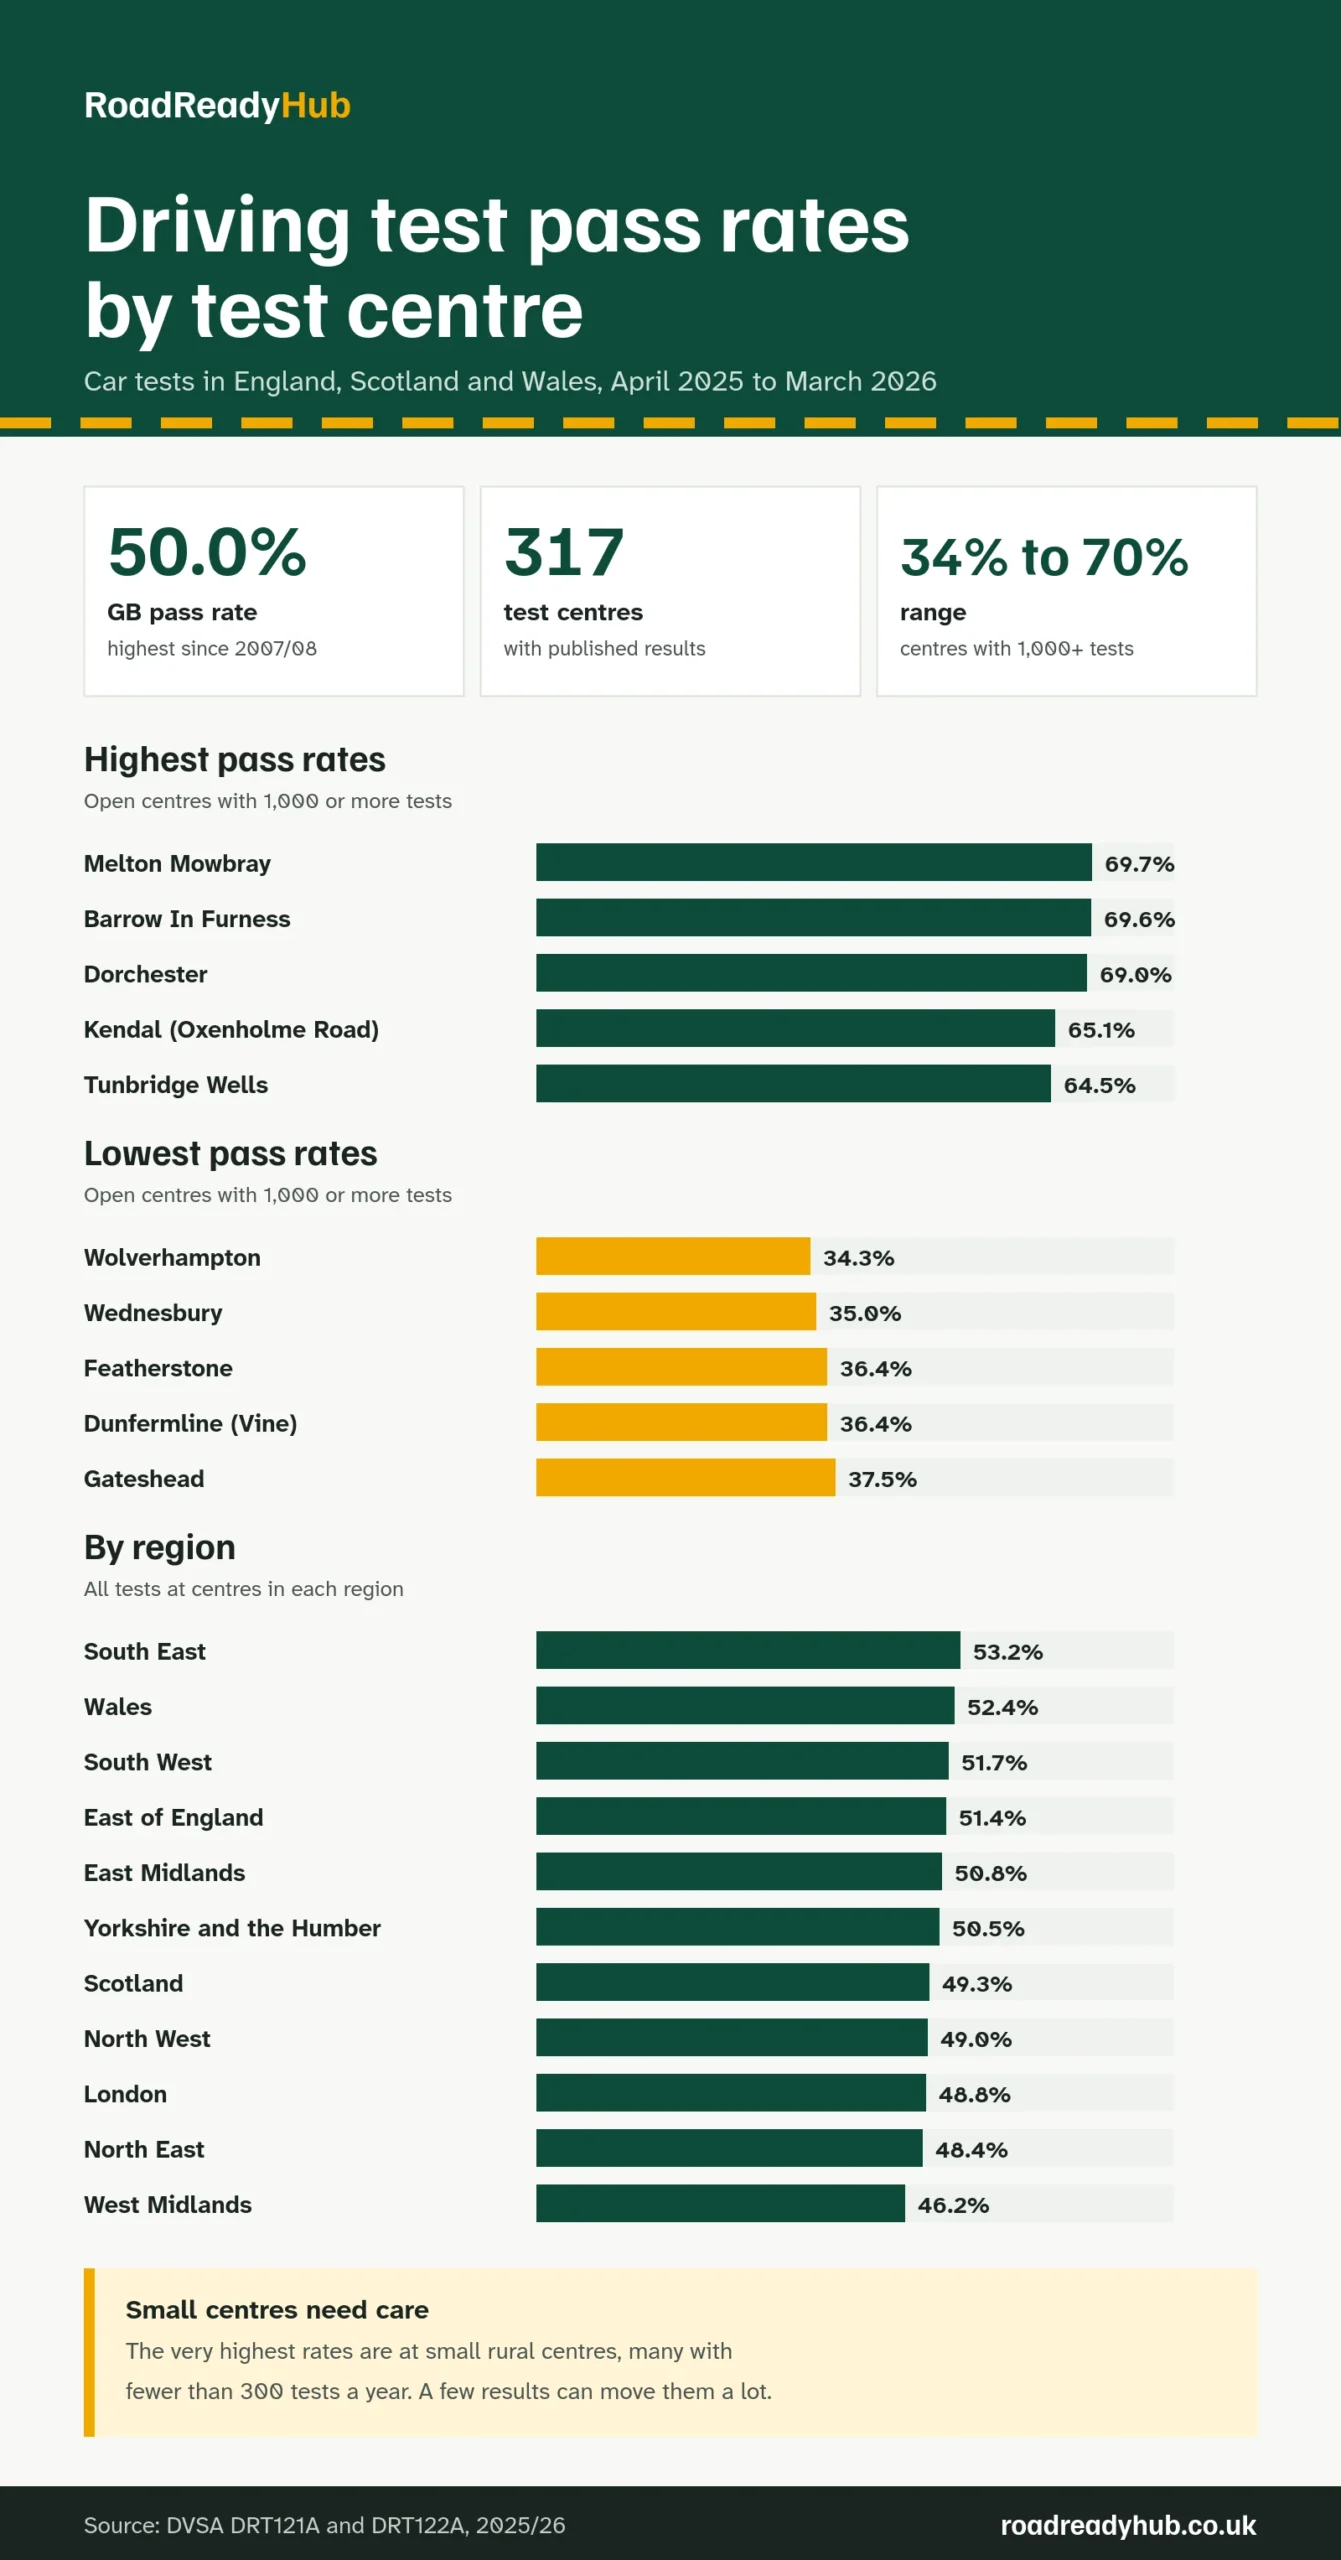
The average car driving test pass rate in Great Britain was 50.0% from April 2025 to March 2026, according to DVSA. Of the test centres that carried out at least 1,000 tests, Melton Mowbray had the highest pass rate at 69.7% and Wolverhampton the lowest at 34.3%. You can search all 317 centres in the table below.
Pass rates at different driving test centres can differ by more than 30 percentage points. DVSA publishes the results for every centre once a year, and this guide uses its latest figures, for April 2025 to March 2026. It shows the highest and lowest centres, the pass rate for your region and every centre in England, Scotland and Wales, plus what the numbers can and cannot tell you about where to take your test.
Driving test pass rates in 2025/26 at a glance
- 1,998,621 car driving tests were taken and 1,000,043 were passed, a pass rate of 50.0%. That is the highest yearly rate in DVSA’s figures, which go back to 2007/08.
- Men passed 50.8% of their tests and women 49.1%.
- Learners taking their first practical test passed 50.5% of the time, and 28,581 of them passed with no faults recorded at all.
- Tests in automatic cars had a lower pass rate of 44.6%.
- The newest quarterly figure, for April to June 2026, is higher again at 51.3%.
Test centres with the highest pass rates
These are the 10 highest pass rates among centres that carried out at least 1,000 car tests in 2025/26. We have left out smaller centres, because a handful of results can swing their rates a long way.
| Rank | Test centre | Region | Tests | Pass rate | 2024/25 |
|---|---|---|---|---|---|
| 1 | Melton Mowbray | East Midlands | 1,984 | 69.7% | 63.9% |
| 2 | Barrow In Furness | North West | 1,699 | 69.6% | 61.9% |
| 3 | Dorchester | South West | 4,353 | 69.0% | 66.7% |
| 4 | Kendal (Oxenholme Road) | North West | 2,231 | 65.1% | 64.8% |
| 5 | Tunbridge Wells | South East | 5,726 | 64.5% | 58.9% |
| 6 | Abergavenny | Wales | 5,924 | 64.2% | 61.1% |
| 7 | Yeovil | South West | 7,493 | 63.4% | 59.7% |
| 8 | Lee On The Solent | South East | 8,502 | 63.2% | 59.6% |
| 9 | Ipswich | East of England | 11,466 | 62.3% | 63.1% |
| 10 | Bangor | Wales | 4,032 | 62.2% | 64.1% |
Melton Mowbray, Barrow-in-Furness and Dorchester all passed close to 7 in 10 candidates. Most of these centres also did well the year before: Dorchester (66.7%), Kendal (64.8%), Bangor (64.1%) and Ipswich (63.1%) all had high rates in 2024/25 too. Ipswich stands out because it is a big centre, with more than 11,000 tests a year.
Small centres with even higher rates
The highest rates of all came from small, mostly rural centres. The Isles of Scilly passed 6 of 8 tests (75.0%), the Isle of Mull 31 of 42 (73.8%) and Gairloch 36 of 49 (73.5%). DVSA warns that results based on low numbers are not statistically robust, and that comparing a centre with fewer than 100 tests against one with more than 1,000 is not reliable. In the full table, centres with fewer than 100 tests are marked with an asterisk.
Test centres with the lowest pass rates
These are the 10 lowest pass rates among open centres with at least 1,000 tests, often described as the hardest test centres. Barking (Tanner Street) in London had a pass rate of 36.3% but has since closed, so it is not included.
| Rank | Test centre | Region | Tests | Pass rate | 2024/25 |
|---|---|---|---|---|---|
| 1 | Wolverhampton | West Midlands | 11,561 | 34.3% | 33.4% |
| 2 | Wednesbury | West Midlands | 7,508 | 35.0% | 36.4% |
| 3 | Dunfermline (Vine) | Scotland | 5,529 | 36.4% | 43.3% |
| 4 | Featherstone | West Midlands | 13,193 | 36.4% | 34.1% |
| 5 | Gateshead | North East | 9,512 | 37.5% | 37.4% |
| 6 | Norris Green (Liverpool) | North West | 13,472 | 37.8% | 38.7% |
| 7 | Luton | East of England | 7,759 | 39.2% | 40.1% |
| 8 | Chingford (London) | London | 13,120 | 39.9% | 36.5% |
| 9 | Glasgow (Shieldhall) | Scotland | 7,019 | 39.9% | 37.7% |
| 10 | Coventry | West Midlands | 13,771 | 40.0% | 42.3% |
Four of the 10 are in the West Midlands. Wolverhampton also had the lowest rate of the larger centres in 2024/25, at 33.4%, so its result is not a one-off. Dunfermline (Vine) is the opposite case: its rate fell by almost 7 points in a year.
Driving test pass rates by region
Adding up the results for every centre in each region gives the pass rates below. The South East was highest and the West Midlands lowest. These are our own calculations from DVSA’s test centre figures, using the regions DVSA gives each centre in its waiting times data.
| Region | Test centres | Tests | Pass rate |
|---|---|---|---|
| South East | 32 | 243,284 | 53.2% |
| Wales | 21 | 96,367 | 52.4% |
| South West | 22 | 153,125 | 51.7% |
| East of England | 24 | 195,108 | 51.4% |
| East Midlands | 20 | 151,674 | 50.8% |
| Yorkshire and the Humber | 29 | 186,490 | 50.5% |
| Scotland | 74 | 140,572 | 49.3% |
| North West | 32 | 256,786 | 49.0% |
| London | 26 | 266,700 | 48.8% |
| North East | 11 | 77,123 | 48.4% |
| West Midlands | 26 | 231,032 | 46.2% |
Scotland has by far the most test centres, 74, because many small rural centres serve the Highlands and islands. London had the most tests of any region but a pass rate below the national average.
The busiest test centres
Birmingham (Garretts Green) carried out more car tests than any other centre in 2025/26: 22,480, with a pass rate of 44.4%. Eight of the 10 busiest centres had pass rates below the national average of 50.0%.
| Test centre | Tests | Pass rate | Median wait, Sept 2026 |
|---|---|---|---|
| Birmingham (Garretts Green) | 22,480 | 44.4% | 11.4 weeks |
| Goodmayes (London) | 21,374 | 43.7% | 11.8 weeks |
| Leicester (Wigston) | 18,868 | 51.2% | 12.7 weeks |
| West Didsbury (Manchester) | 17,806 | 47.7% | 19.9 weeks |
| Cardiff (Llanishen) | 16,401 | 46.5% | 7.7 weeks |
| Birmingham (Kingstanding) | 16,133 | 48.5% | 16.1 weeks |
| Chadderton | 15,988 | 46.8% | 16.1 weeks |
| Morden (London) | 15,770 | 51.0% | 19.1 weeks |
| Nottingham (Colwick) | 15,150 | 46.4% | 13.3 weeks |
| Warwick (Wedgenock House) | 15,070 | 48.5% | 9.8 weeks |
Find your test centre: pass rates for every centre
Type a town or area to filter the list, or select a column heading to sort it. The table covers all 317 centres with published car test results for April 2025 to March 2026.
| Test centre | Region | Tests | Pass rate | 2024/25 | 1st attempt | Automatic | Wait (weeks) |
|---|---|---|---|---|---|---|---|
| Aberdeen North | Scotland | 3,906 | 48.2% | 43.1% | 48.5% | 40.7% | 16.5 |
| Aberdeen South (Cove) | Scotland | 4,858 | 52.4% | 51.4% | 51.4% | 42.3% | 9.1 |
| Aberfeldy | Scotland | 149 | 68.5% | n/a | 73.1% | n/a | 22.6 |
| Abergavenny | Wales | 5,924 | 64.2% | 61.1% | 64.7% | 54.8% | 3.9 |
| Aberystwyth (Park Avenue) | Wales | 1,529 | 55.1% | 53.2% | 52.1% | 61.2% | 7.0 |
| Airdrie | Scotland | 4,599 | 47.4% | 41.3% | 47.4% | 44.6% | 7.1 |
| Alness | Scotland | 783 | 63.1% | 63.0% | 63.1% | 60.2% | 14.0 |
| Alnwick | North East | 1,282 | 55.5% | 51.0% | 62.5% | 32.6% | 14.6 |
| Arbroath | Scotland | 605 | 67.4% | 78.9% | 70.5% | 52.8% | 29.9 |
| Ashfield | East Midlands | 8,144 | 57.3% | 51.2% | 59.2% | 49.6% | 15.3 |
| Ashford (Kent) | South East | 5,475 | 46.2% | 52.0% | 45.9% | 42.1% | 7.1 |
| Atherton (Manchester) | North West | 13,035 | 44.3% | 44.4% | 45.1% | 37.9% | 10.0 |
| Aylesbury | South East | 5,255 | 49.3% | 48.7% | 48.2% | 46.2% | 7.3 |
| Ayr | Scotland | 2,189 | 57.5% | 56.8% | 58.0% | 46.4% | 8.0 |
| Bala | Wales | 607 | 61.6% | 61.1% | 64.8% | 45.7% | 16.1 |
| Banbury | South East | 9,069 | 41.3% | 39.9% | 39.6% | 35.8% | 12.1 |
| Banff | Scotland | 280 | 57.5% | 50.6% | 54.8% | n/a | 10.6 |
| Bangor | Wales | 4,032 | 62.2% | 64.1% | 62.7% | 49.9% | 10.9 |
| Barking (Tanner Street) (now closed) | London | 5,543 | 36.3% | 37.9% | 30.6% | 33.4% | n/a |
| Barnet (London) | London | 12,397 | 49.9% | 49.9% | 48.8% | 48.1% | 19.1 |
| Barnsley | Yorkshire and the Humber | 7,737 | 58.5% | 52.2% | 60.6% | 56.6% | 7.3 |
| Barnstaple | South West | 5,562 | 51.4% | 54.7% | 53.8% | 41.8% | 7.4 |
| Barrow In Furness | North West | 1,699 | 69.6% | 61.9% | 70.0% | 58.1% | 6.4 |
| Barry | Wales | 2,244 | 57.0% | 61.8% | 55.5% | 49.8% | 9.1 |
| Basildon | East of England | 8,359 | 49.1% | 45.6% | 49.0% | 45.2% | 3.7 |
| Basingstoke | South East | 5,009 | 56.8% | 56.9% | 57.7% | 52.1% | 10.1 |
| Bedford | East of England | 8,854 | 53.7% | 49.9% | 54.4% | 46.8% | 3.3 |
| Belvedere (London) | London | 4,245 | 40.5% | 38.3% | 39.1% | 38.3% | 4.3 |
| Benbecula Island | Scotland | 107 | 72.9% | 78.8% | 73.2% | n/a | n/a |
| Berwick-On-Tweed | North East | 666 | 53.9% | 54.3% | 52.5% | 41.2% | 22.1 |
| Beverley LGV | Yorkshire and the Humber | 159 | 54.1% | 55.1% | 64.5% | n/a | n/a |
| Birmingham (Cocks Moors) | West Midlands | 486 | 53.5% | n/a | 55.5% | 46.5% | 4.7 |
| Birmingham (Garretts Green) | West Midlands | 22,480 | 44.4% | 42.0% | 42.0% | 41.0% | 11.4 |
| Birmingham (Kings Heath) | West Midlands | 9,072 | 46.8% | 47.0% | 45.6% | 44.7% | 10.1 |
| Birmingham (Kingstanding) | West Midlands | 16,133 | 48.5% | 44.6% | 47.2% | 45.3% | 16.1 |
| Birmingham (Shirley) | West Midlands | 9,385 | 56.6% | 58.1% | 58.3% | 49.8% | 19.0 |
| Birmingham (South Yardley) | West Midlands | 14,471 | 42.8% | 41.6% | 40.5% | 37.8% | 11.9 |
| Bishopbriggs | Scotland | 6,186 | 49.8% | 50.5% | 53.6% | 41.7% | 21.0 |
| Bishops Stortford | East of England | 6,409 | 51.3% | 50.4% | 50.9% | 42.8% | 5.9 |
| Blackburn with Darwen | North West | 12,205 | 46.6% | 47.8% | 45.5% | 45.7% | 13.1 |
| Blackpool | North West | 8,948 | 51.8% | 49.6% | 51.9% | 47.7% | 9.1 |
| Bletchley | South East | 9,415 | 51.5% | 45.7% | 49.6% | 47.9% | 4.0 |
| Blyth | North East | 6,973 | 50.9% | 47.2% | 53.9% | 39.4% | 11.7 |
| Bodmin | South West | 6,392 | 47.5% | 46.1% | 45.2% | 41.1% | 5.4 |
| Bolton (Manchester) | North West | 11,570 | 51.8% | 56.7% | 52.8% | 46.7% | 12.4 |
| Borehamwood (London) | East of England | 7,195 | 50.8% | 46.8% | 49.2% | 48.4% | 15.6 |
| Boston | East Midlands | 4,784 | 50.7% | 50.7% | 52.8% | 39.9% | 3.6 |
| Bradford (Heaton) | Yorkshire and the Humber | 8,354 | 56.1% | 49.5% | 54.3% | 55.0% | 13.4 |
| Bradford (Thornbury) | Yorkshire and the Humber | 10,831 | 47.8% | 47.1% | 47.5% | 42.3% | 9.4 |
| Brecon | Wales | 1,490 | 58.7% | 58.9% | 60.3% | 50.0% | 7.4 |
| Bredbury (Manchester) | North West | 10,636 | 56.0% | 54.2% | 57.9% | 47.6% | 16.1 |
| Brentwood (London) | East of England | 5,791 | 48.5% | 48.5% | 47.1% | 46.1% | 5.3 |
| Bridgend | Wales | 5,990 | 53.3% | 53.1% | 55.1% | 43.0% | 7.3 |
| Bridlington | Yorkshire and the Humber | 3,027 | 55.5% | 56.4% | 55.6% | 44.0% | 13.0 |
| Bristol (Avonmouth) | South West | 9,400 | 55.5% | 53.7% | 55.4% | 51.2% | 12.1 |
| Bristol (Kingswood) | South West | 14,863 | 51.9% | 52.0% | 53.4% | 43.8% | 5.9 |
| Brodick (Isle of Arran)* | Scotland | 55 | 67.3% | n/a | n/a | n/a | 23.9 |
| Bromley (London) | London | 13,228 | 52.9% | 51.7% | 52.9% | 51.0% | 7.9 |
| Buckie | Scotland | 268 | 51.1% | 52.6% | 46.3% | n/a | 9.4 |
| Burgess Hill | South East | 11,237 | 45.5% | 43.2% | 45.6% | 40.4% | 12.1 |
| Burton on Trent | West Midlands | 7,273 | 54.7% | 54.1% | 56.5% | 43.9% | 13.9 |
| Bury (Manchester) | North West | 7,024 | 46.3% | 40.3% | 45.7% | 38.9% | 5.7 |
| Bury St Edmunds | East of England | 8,702 | 46.2% | 45.7% | 46.9% | 40.1% | 12.7 |
| Buxton | East Midlands | 4,904 | 58.7% | 57.0% | 61.4% | 47.6% | 17.4 |
| Callander | Scotland | 335 | 49.9% | 47.4% | 49.7% | n/a | 29.7 |
| Camborne | South West | 6,271 | 40.6% | 41.3% | 37.8% | 30.0% | 4.4 |
| Cambridge (Brookmount Court) | East of England | 13,689 | 53.8% | 50.5% | 53.4% | 47.9% | 24.3 |
| Campbeltown | Scotland | 109 | 71.6% | 62.6% | 76.0% | n/a | 25.7 |
| Canterbury | South East | 4,670 | 45.8% | 50.3% | 46.3% | 43.0% | 5.4 |
| Cardiff (Llanishen) | Wales | 16,401 | 46.5% | 51.3% | 48.4% | 39.2% | 7.7 |
| Cardigan | Wales | 1,192 | 41.0% | 49.8% | 39.5% | n/a | 6.0 |
| Carlisle | North West | 3,518 | 58.7% | 54.9% | 59.9% | 48.9% | 13.8 |
| Carlisle LGV (Cars)* | North West | 47 | 44.7% | 61.9% | n/a | n/a | 0.6 |
| Carmarthen | Wales | 2,746 | 54.2% | 54.4% | 54.1% | 44.1% | 9.9 |
| Castle Douglas | Scotland | 549 | 53.4% | 50.2% | 60.4% | 32.0% | 17.1 |
| Chadderton | North West | 15,988 | 46.8% | 44.9% | 45.6% | 40.7% | 16.1 |
| Cheetham Hill (Manchester) | North West | 10,207 | 44.7% | 43.7% | 44.1% | 41.5% | 10.0 |
| Chelmsford | East of England | 9,107 | 55.4% | n/a | 55.0% | 49.2% | 20.9 |
| Cheltenham | South West | 5,161 | 43.2% | 46.7% | 42.9% | 35.6% | 17.0 |
| Chertsey (London) | South East | 9,082 | 52.9% | 50.3% | 52.5% | 47.3% | 21.7 |
| Chester | North West | 9,212 | 47.3% | 46.2% | 47.9% | 40.1% | 7.5 |
| Chesterfield | East Midlands | 6,605 | 56.2% | 54.5% | 56.5% | 48.0% | 7.9 |
| Chichester | South East | 6,672 | 61.6% | 64.2% | 63.3% | 54.7% | 3.7 |
| Chingford (London) | London | 13,120 | 39.9% | 36.5% | 37.5% | 38.3% | 12.6 |
| Chippenham | South West | 9,629 | 56.4% | 50.6% | 56.0% | 50.6% | 11.7 |
| Chorley | North West | 5,415 | 52.8% | 48.3% | 54.0% | 46.2% | 5.4 |
| Clacton-on-Sea | East of England | 4,840 | 48.2% | 47.4% | 48.9% | 43.8% | 6.4 |
| Colchester | East of England | 7,756 | 50.6% | 48.0% | 51.1% | 43.5% | 12.1 |
| Coventry | West Midlands | 13,771 | 40.0% | 42.3% | 38.3% | 35.6% | 11.9 |
| Crawley | South East | 11,305 | 42.7% | 40.1% | 42.7% | 39.0% | 17.8 |
| Crewe | North West | 4,994 | 43.8% | 44.4% | 42.6% | 37.8% | 12.1 |
| Cumnock | Scotland | 760 | 67.4% | 61.1% | 69.5% | 56.0% | 23.0 |
| Darlington | North East | 12,183 | 47.1% | 49.2% | 48.9% | 40.5% | 7.6 |
| Derby (Alvaston) | East Midlands | 8,086 | 51.8% | 51.3% | 52.9% | 46.3% | 12.3 |
| Doncaster | Yorkshire and the Humber | 7,334 | 53.2% | 42.0% | 53.3% | 49.1% | 21.6 |
| Dorchester | South West | 4,353 | 69.0% | 66.7% | 71.8% | 59.3% | 10.6 |
| Dudley | West Midlands | 13,721 | 45.2% | 45.7% | 45.1% | 41.5% | 18.0 |
| Dumbarton | Scotland | 1,659 | 52.8% | 53.5% | 51.4% | 46.7% | 4.4 |
| Dumfries | Scotland | 2,267 | 53.9% | 47.0% | 59.2% | 41.0% | 16.3 |
| Dundee | Scotland | 3,742 | 57.3% | 60.3% | 57.9% | 48.3% | 14.6 |
| Dunfermline (Vine) | Scotland | 5,529 | 36.4% | 43.3% | 36.4% | 30.0% | 11.6 |
| Dunoon | Scotland | 193 | 71.5% | 62.8% | 72.2% | n/a | 21.9 |
| Duns | Scotland | 171 | 70.2% | 74.2% | 69.2% | n/a | 21.7 |
| Durham | North East | 9,451 | 53.2% | 49.6% | 54.8% | 47.8% | 15.9 |
| East Kilbride | Scotland | 1,976 | 57.7% | 46.4% | 58.2% | 46.0% | 23.0 |
| Eastbourne | South East | 6,031 | 55.4% | 52.1% | 56.6% | 50.2% | 13.4 |
| Edinburgh (Currie) | Scotland | 6,202 | 41.6% | 43.2% | 42.8% | 36.0% | 20.3 |
| Edinburgh (Musselburgh) | Scotland | 6,850 | 49.4% | 47.0% | 49.9% | 44.6% | 19.7 |
| Elgin | Scotland | 2,934 | 42.3% | 44.5% | 41.3% | 35.0% | 9.7 |
| Enfield (Brancroft Way) | London | 362 | 46.1% | 42.4% | 51.1% | 50.0% | 2.6 |
| Enfield (Innova Business Park) | London | 8,412 | 53.9% | 54.1% | 53.6% | 50.0% | 2.4 |
| Erith (London) | London | 5,809 | 51.6% | 49.3% | 49.8% | 50.4% | 8.6 |
| Exeter | South West | 8,679 | 46.8% | 47.9% | 45.6% | 38.5% | 6.4 |
| Farnborough | South East | 10,482 | 59.7% | 58.3% | 60.1% | 52.2% | 19.6 |
| Featherstone | West Midlands | 13,193 | 36.4% | 34.1% | 35.1% | 35.3% | 11.9 |
| Folkestone | South East | 7,818 | 42.4% | 45.4% | 42.2% | 34.3% | 7.1 |
| Forfar | Scotland | 667 | 60.3% | 68.5% | 59.4% | 56.1% | 28.2 |
| Fort William | Scotland | 374 | 65.5% | 62.0% | 69.2% | n/a | 15.0 |
| Fraserburgh | Scotland | 531 | 64.0% | 60.7% | 63.6% | n/a | 16.0 |
| Gairloch* | Scotland | 49 | 73.5% | 69.2% | n/a | n/a | 8.3 |
| Galashiels | Scotland | 2,241 | 47.4% | 49.1% | 50.7% | 41.2% | 5.1 |
| Gateshead | North East | 9,512 | 37.5% | 37.4% | 37.1% | 32.7% | 11.1 |
| Gillingham | South East | 14,886 | 56.4% | 57.2% | 57.6% | 51.9% | 12.0 |
| Girvan | Scotland | 250 | 72.0% | 68.7% | 70.3% | 66.7% | 15.9 |
| Glasgow (Anniesland) | Scotland | 6,170 | 44.3% | 40.8% | 44.3% | 41.2% | 21.6 |
| Glasgow (Baillieston) | Scotland | 10,428 | 47.4% | 44.4% | 48.0% | 40.9% | 20.0 |
| Glasgow (Shieldhall) | Scotland | 7,019 | 39.9% | 37.7% | 39.0% | 37.2% | 18.0 |
| Gloucester | South West | 7,420 | 47.8% | 49.6% | 48.3% | 36.5% | 16.2 |
| Golspie* | Scotland | 93 | 71.0% | 68.0% | 64.7% | n/a | 18.9 |
| Goodmayes (London) | London | 21,374 | 43.7% | 43.7% | 40.6% | 41.5% | 11.8 |
| Gosforth | North East | 10,531 | 48.4% | 47.5% | 48.7% | 44.3% | 21.1 |
| Grangemouth | Scotland | 3,761 | 50.7% | 46.4% | 50.4% | 40.0% | 21.9 |
| Grantham (Somerby) | East Midlands | 7,318 | 57.9% | 58.1% | 59.6% | 49.9% | 18.4 |
| Grantown-On-Spey | Scotland | 137 | 56.9% | 62.2% | 58.3% | n/a | 18.9 |
| Greenford (Horsenden Lane) | London | 7,222 | 41.4% | 40.5% | 40.0% | 41.0% | 18.4 |
| Greenham | South East | 3,931 | 56.5% | 52.1% | 55.9% | 51.9% | 8.7 |
| Greenock | Scotland | 3,547 | 41.7% | 42.4% | 40.5% | 35.9% | 7.9 |
| Grimsby Coldwater | Yorkshire and the Humber | 5,361 | 42.8% | 42.7% | 43.1% | 35.9% | 5.3 |
| Guildford | South East | 4,542 | 57.1% | 51.8% | 56.8% | 50.8% | 7.8 |
| Haddington | Scotland | 2,195 | 57.5% | 62.2% | 58.2% | 46.3% | 23.9 |
| Halifax | Yorkshire and the Humber | 5,845 | 45.0% | 44.7% | 42.9% | 41.6% | 13.6 |
| Hamilton | Scotland | 6,112 | 42.0% | 39.5% | 40.7% | 34.5% | 19.3 |
| Hartlepool | North East | 5,847 | 51.0% | 49.7% | 51.9% | 45.3% | 15.1 |
| Hastings (Ore) | South East | 3,892 | 52.4% | 49.2% | 51.7% | 51.6% | 17.1 |
| Hawick | Scotland | 415 | 64.3% | 61.1% | 68.5% | 51.0% | 15.9 |
| Heckmondwike | Yorkshire and the Humber | 5,471 | 45.8% | 46.7% | 45.8% | 41.2% | 15.7 |
| Hendon (London) | London | 11,086 | 51.4% | 49.5% | 49.9% | 51.0% | 21.1 |
| Hereford | West Midlands | 4,110 | 58.8% | 59.4% | 60.0% | 47.9% | 2.9 |
| Herne Bay | South East | 10,674 | 55.9% | 55.4% | 56.3% | 52.2% | 8.6 |
| Hexham | North East | 1,388 | 53.0% | 56.7% | 55.0% | 37.2% | 17.9 |
| Heysham | North West | 3,692 | 59.2% | 55.0% | 61.9% | 48.7% | 18.3 |
| High Wycombe | South East | 3,534 | 51.5% | 51.0% | 49.0% | 47.0% | 6.1 |
| Hinckley | East Midlands | 4,866 | 46.4% | 48.3% | 46.2% | 37.5% | 9.6 |
| Hornchurch (London) | London | 8,694 | 46.3% | 48.3% | 45.9% | 43.4% | 22.3 |
| Horsforth | Yorkshire and the Humber | 12,466 | 49.7% | 51.3% | 51.1% | 45.2% | 11.6 |
| Huddersfield | Yorkshire and the Humber | 10,563 | 49.2% | 48.4% | 49.4% | 43.4% | 14.3 |
| Hull | Yorkshire and the Humber | 9,706 | 47.9% | 45.2% | 49.3% | 41.5% | 4.4 |
| Huntly | Scotland | 245 | 63.7% | 62.5% | 62.8% | n/a | 15.6 |
| Inveraray | Scotland | 124 | 69.4% | 85.1% | 75.4% | n/a | 23.3 |
| Inverness (Longman Drive) | Scotland | 3,252 | 45.8% | 45.9% | 45.2% | 39.7% | 6.6 |
| Inverurie | Scotland | 749 | 61.9% | 54.3% | 63.8% | 44.0% | 12.4 |
| Ipswich | East of England | 11,466 | 62.3% | 63.1% | 63.0% | 56.4% | 5.3 |
| Irvine | Scotland | 4,941 | 55.7% | 49.2% | 56.6% | 54.5% | 17.6 |
| Isle of Mull* | Scotland | 42 | 73.8% | 71.4% | n/a | n/a | n/a |
| Isle of Skye (Portree) | Scotland | 128 | 57.0% | 69.9% | 57.6% | n/a | 3.4 |
| Isles of Scilly* | South West | 8 | 75.0% | 87.5% | n/a | n/a | 15.9 |
| Isleworth (Fleming Way) | London | 12,687 | 50.4% | 51.8% | 49.7% | 47.8% | 20.9 |
| Kelso | Scotland | 434 | 59.2% | 57.0% | 59.3% | 45.5% | 24.7 |
| Kendal (Oxenholme Road) | North West | 2,231 | 65.1% | 64.8% | 67.1% | 53.2% | 8.9 |
| Kettering | East Midlands | 11,876 | 49.1% | 46.0% | 50.1% | 41.0% | 4.7 |
| Kings Lynn | East of England | 6,694 | 51.9% | 46.0% | 52.9% | 40.7% | 16.0 |
| Kingussie* | Scotland | 93 | 59.1% | 64.1% | 61.4% | n/a | 7.5 |
| Kirkcaldy | Scotland | 4,313 | 50.9% | 47.5% | 49.7% | 44.1% | 15.3 |
| Knaresborough | Yorkshire and the Humber | 8,301 | 58.5% | 58.5% | 60.8% | 53.3% | 6.9 |
| Kyle of Lochalsh | Scotland | 136 | 57.4% | 58.5% | 56.5% | n/a | 7.7 |
| Lanark | Scotland | 1,914 | 58.1% | 55.0% | 58.5% | 47.1% | 20.4 |
| Launceston | South West | 3,991 | 46.3% | 48.3% | 47.0% | 34.8% | 6.4 |
| Lee On The Solent | South East | 8,502 | 63.2% | 59.6% | 65.5% | 53.1% | 18.9 |
| Leeds (Colton Mill) | Yorkshire and the Humber | 6,432 | 51.8% | n/a | 53.4% | 47.0% | 13.9 |
| Leeds (Fearnville) | Yorkshire and the Humber | 4,676 | 51.8% | n/a | 52.8% | 47.6% | n/a |
| Leicester (Cannock Street) | East Midlands | 14,198 | 40.2% | 37.7% | 38.5% | 35.3% | 7.9 |
| Leicester (Wigston) | East Midlands | 18,868 | 51.2% | 43.9% | 50.2% | 46.1% | 12.7 |
| Leighton Buzzard (Stanbridge Road) | East of England | 7,667 | 49.9% | 51.0% | 48.8% | 46.2% | 25.1 |
| Lerwick | Scotland | 379 | 67.8% | 67.8% | 70.3% | 62.7% | 14.4 |
| Letchworth | East of England | 5,243 | 57.5% | 58.3% | 59.3% | 51.3% | 21.0 |
| Lichfield | West Midlands | 5,944 | 53.0% | 48.6% | 53.3% | 46.0% | 17.0 |
| Lincoln | East Midlands | 6,192 | 52.1% | 49.8% | 52.5% | 44.5% | 12.7 |
| Livingston | Scotland | 2,997 | 55.7% | 50.7% | 56.3% | 47.6% | 8.2 |
| Llanelli | Wales | 4,380 | 51.0% | 51.0% | 52.4% | 43.2% | 7.0 |
| Llantrisant | Wales | 9,909 | 54.0% | 50.6% | 55.5% | 45.0% | 6.4 |
| Lochgilphead | Scotland | 140 | 56.4% | 62.5% | 55.4% | n/a | 23.1 |
| Loughborough | East Midlands | 5,502 | 42.3% | 43.7% | 42.6% | 33.2% | 10.5 |
| Loughton (London) | East of England | 7,376 | 47.0% | 48.0% | 48.0% | 45.3% | 20.9 |
| Louth | East Midlands | 740 | 53.9% | 54.4% | 56.0% | 41.1% | 9.0 |
| Lowestoft(Mobbs Way) | East of England | 7,603 | 43.3% | 46.1% | 44.1% | 35.2% | 18.4 |
| Ludlow | West Midlands | 5,051 | 58.7% | 59.6% | 61.6% | 45.1% | 10.0 |
| Luton | East of England | 7,759 | 39.2% | 40.1% | 35.8% | 36.5% | 9.9 |
| Macclesfield | North West | 4,509 | 51.9% | 49.9% | 52.2% | 44.7% | 16.4 |
| Maidstone | South East | 8,053 | 60.2% | 58.0% | 61.6% | 53.6% | 9.7 |
| Mallaig* | Scotland | 53 | 64.2% | 63.0% | n/a | n/a | 22.0 |
| Malton | Yorkshire and the Humber | 876 | 64.3% | 66.7% | 65.2% | 58.8% | 12.6 |
| Melton Mowbray | East Midlands | 1,984 | 69.7% | 63.9% | 71.2% | 62.6% | 20.0 |
| Merthyr Tydfil | Wales | 4,446 | 51.2% | 53.5% | 50.3% | 42.7% | 8.9 |
| Middlesbrough | North East | 8,854 | 47.7% | 48.3% | 47.1% | 43.6% | 15.9 |
| Mill Hill (London) | London | 9,797 | 51.4% | 51.1% | 50.3% | 51.2% | 16.4 |
| Mitcham (London) | London | 15,046 | 47.0% | 48.9% | 46.3% | 45.4% | 16.1 |
| Monmouth | Wales | 1,283 | 51.0% | 61.2% | 52.8% | 40.3% | 4.7 |
| Montrose | Scotland | 621 | 70.0% | 66.7% | 71.4% | 62.7% | 18.9 |
| Morden (London) | London | 15,770 | 51.0% | 48.8% | 50.4% | 49.8% | 19.1 |
| Nelson | North West | 5,955 | 51.7% | 47.9% | 52.1% | 49.4% | 18.9 |
| Newport (Gwent) | Wales | 8,227 | 48.9% | 51.0% | 50.1% | 41.6% | 6.7 |
| Newport (Isle of Wight) | South East | 3,616 | 54.1% | 52.4% | 56.4% | 44.9% | 7.1 |
| Newton Abbot | South West | 6,591 | 53.8% | 51.9% | 54.5% | 46.9% | 16.0 |
| Newton Stewart | Scotland | 225 | 65.8% | 63.2% | 64.0% | n/a | 18.1 |
| Newtown | Wales | 2,256 | 58.0% | 63.7% | 59.5% | 47.4% | 14.1 |
| Norris Green (Liverpool) | North West | 13,472 | 37.8% | 38.7% | 36.0% | 34.9% | 18.0 |
| Northallerton | Yorkshire and the Humber | 3,244 | 60.4% | 58.6% | 62.7% | 51.0% | 14.3 |
| Northampton | East Midlands | 13,539 | 52.1% | 50.4% | 51.8% | 45.9% | 8.6 |
| Northwich | North West | 3,529 | 57.6% | 54.7% | 57.3% | 48.7% | 7.3 |
| Norwich (Peachman Way) | East of England | 12,541 | 61.7% | 57.0% | 63.1% | 55.4% | 9.0 |
| Nottingham (Chilwell) | East Midlands | 9,415 | 49.9% | 43.9% | 49.2% | 43.4% | 5.1 |
| Nottingham (Colwick) | East Midlands | 15,150 | 46.4% | 45.5% | 47.6% | 42.4% | 13.3 |
| Nuneaton | West Midlands | 6,764 | 53.2% | 52.5% | 54.6% | 45.5% | 9.0 |
| Oban | Scotland | 322 | 66.1% | 61.3% | 66.3% | n/a | 18.0 |
| Orkney | Scotland | 320 | 55.9% | 66.0% | 51.3% | n/a | 11.0 |
| Oswestry | West Midlands | 1,851 | 52.4% | 55.6% | 54.3% | 39.0% | 11.7 |
| Oxford (Cowley) | South East | 5,419 | 50.6% | 48.2% | 49.0% | 46.6% | 4.4 |
| Paisley | Scotland | 7,912 | 48.6% | 46.6% | 47.1% | 44.0% | 18.1 |
| Peebles | Scotland | 685 | 58.8% | 67.0% | 63.1% | 38.5% | 24.1 |
| Pembroke Dock | Wales | 1,769 | 50.1% | 57.9% | 50.5% | 43.2% | 5.1 |
| Penzance | South West | 507 | 46.5% | 49.2% | 43.4% | 37.7% | 10.7 |
| Perth (Arran Road) | Scotland | 2,642 | 48.8% | 46.0% | 47.2% | 38.5% | 11.6 |
| Peterborough | East of England | 10,551 | 52.8% | 50.2% | 53.2% | 47.6% | 15.4 |
| Peterhead | Scotland | 2,628 | 53.2% | 57.8% | 53.3% | 41.1% | 6.4 |
| Pinner (London) | London | 14,367 | 49.7% | 50.3% | 48.5% | 47.6% | 23.1 |
| Pitlochry | Scotland | 146 | 73.3% | n/a | 73.8% | n/a | 19.9 |
| Plymouth | South West | 11,167 | 40.7% | 40.8% | 38.8% | 34.5% | 7.1 |
| Pontefract | Yorkshire and the Humber | 5,544 | 46.9% | 47.8% | 47.0% | 39.5% | 15.7 |
| Poole | South West | 10,375 | 53.4% | 48.4% | 53.0% | 45.1% | 8.8 |
| Portsmouth | South East | 13,518 | 52.8% | 51.8% | 52.9% | 46.1% | 16.1 |
| Preston | North West | 9,194 | 56.3% | 53.7% | 56.9% | 49.0% | 14.4 |
| Pwllheli | Wales | 737 | 68.1% | 66.0% | 66.7% | 58.8% | 16.3 |
| Reading | South East | 9,237 | 55.4% | 49.8% | 55.4% | 52.7% | 6.3 |
| Redditch | West Midlands | 4,483 | 51.4% | 46.7% | 51.5% | 50.8% | 4.0 |
| Redhill Aerodrome | South East | 5,408 | 53.9% | 49.4% | 53.5% | 49.7% | 13.3 |
| Rhyl | Wales | 4,011 | 56.9% | 55.9% | 56.7% | 50.5% | 9.6 |
| Rochdale (Manchester) | North West | 11,563 | 48.3% | 41.2% | 48.6% | 42.8% | 5.6 |
| Rotherham | Yorkshire and the Humber | 9,134 | 53.1% | 51.3% | 54.7% | 48.8% | 7.1 |
| Rothesay | Scotland | 125 | 52.0% | n/a | 52.7% | n/a | 21.7 |
| Rugby | West Midlands | 6,664 | 51.4% | 46.0% | 55.0% | 43.7% | 10.8 |
| Sale (Manchester) | North West | 10,921 | 51.4% | 49.1% | 53.0% | 45.1% | 18.3 |
| Salisbury | South West | 6,630 | 48.5% | 52.5% | 48.3% | 37.0% | 6.1 |
| Scarborough | Yorkshire and the Humber | 3,595 | 45.1% | 51.7% | 45.2% | 36.4% | 2.9 |
| Scunthorpe | Yorkshire and the Humber | 6,103 | 45.4% | 44.4% | 44.0% | 37.1% | 5.6 |
| Sevenoaks | South East | 6,740 | 59.0% | 53.6% | 60.9% | 54.2% | 15.0 |
| Sheffield (Handsworth) | Yorkshire and the Humber | 9,788 | 44.1% | 45.3% | 44.7% | 39.8% | 6.1 |
| Sheffield (Middlewood Road) | Yorkshire and the Humber | 10,442 | 48.7% | 47.5% | 50.3% | 43.2% | 17.3 |
| Shrewsbury | West Midlands | 5,064 | 51.0% | 49.2% | 53.2% | 41.3% | 10.1 |
| Sidcup (London) | London | 14,318 | 58.7% | 59.0% | 59.5% | 56.7% | 23.0 |
| Skegness | East Midlands | 2,078 | 55.9% | 57.6% | 55.4% | 41.3% | 17.9 |
| Skipton | Yorkshire and the Humber | 3,197 | 57.3% | 54.4% | 55.5% | 55.1% | 13.8 |
| Slough (London) | South East | 10,509 | 50.8% | 45.6% | 48.4% | 46.3% | 22.1 |
| Southall (London) | London | 8,543 | 44.8% | 46.2% | 41.8% | 41.7% | 5.4 |
| Southampton (Maybush) | South East | 10,480 | 50.3% | 47.1% | 50.6% | 45.0% | 14.4 |
| Southend-on-Sea | East of England | 7,526 | 47.0% | 48.1% | 47.0% | 41.0% | 17.6 |
| Southport (Liverpool) | North West | 7,949 | 56.5% | 59.2% | 57.2% | 51.6% | 18.0 |
| Speke (Liverpool) | North West | 8,159 | 40.5% | 38.6% | 41.5% | 37.2% | 7.5 |
| St Albans | East of England | 7,336 | 50.7% | 48.4% | 49.4% | 47.7% | 6.0 |
| St Helens (Liverpool) | North West | 14,174 | 40.9% | 40.2% | 42.1% | 34.1% | 11.4 |
| Stafford | West Midlands | 5,365 | 45.8% | 46.1% | 45.8% | 33.8% | 16.2 |
| Steeton | Yorkshire and the Humber | 4,784 | 52.8% | 50.5% | 52.6% | 47.9% | 15.6 |
| Stevenage | East of England | 4,622 | 55.3% | 44.9% | 55.8% | 48.5% | 3.7 |
| Stirling | Scotland | 2,747 | 43.0% | 38.7% | 44.3% | 33.7% | 12.4 |
| Stoke-On-Trent (Cobridge) | West Midlands | 8,413 | 40.6% | 38.8% | 38.7% | 35.2% | 14.0 |
| Stoke-on-Trent (Newcastle-Under-Lyme) | West Midlands | 6,646 | 41.6% | 40.7% | 40.0% | 35.5% | 19.1 |
| Stornoway | Scotland | 344 | 66.6% | 56.1% | 67.6% | n/a | 9.9 |
| Stranraer | Scotland | 215 | 71.2% | 73.4% | 70.1% | n/a | 20.3 |
| Sunderland | North East | 10,436 | 51.1% | 47.1% | 51.3% | 42.7% | 9.0 |
| Swansea | Wales | 12,375 | 48.2% | 52.1% | 51.2% | 38.4% | 7.3 |
| Swindon | South West | 12,857 | 51.1% | 49.3% | 50.8% | 45.4% | 12.1 |
| Taunton | South West | 8,259 | 59.5% | 56.3% | 59.2% | 52.9% | 12.6 |
| Telford | West Midlands | 4,963 | 48.9% | 43.9% | 48.1% | 43.9% | 16.0 |
| Thurso | Scotland | 162 | 63.0% | 58.1% | 64.4% | n/a | 14.5 |
| Tilbury | East of England | 5,083 | 50.4% | 49.1% | 50.3% | 46.0% | 5.2 |
| Tolworth (London) | London | 10,164 | 53.6% | 53.3% | 53.7% | 49.9% | 23.1 |
| Tottenham | London | 9,844 | 48.9% | 47.9% | 48.1% | 48.0% | 6.7 |
| Trowbridge | South West | 3,074 | 55.2% | 51.1% | 56.4% | 51.5% | 5.6 |
| Tunbridge Wells | South East | 5,726 | 64.5% | 58.9% | 65.4% | 61.0% | 10.6 |
| Ullapool* | Scotland | 49 | 61.2% | 74.6% | n/a | n/a | 11.1 |
| Upton | North West | 10,772 | 52.6% | 50.0% | 54.9% | 47.5% | 12.1 |
| Uxbridge (London) | London | 6,051 | 52.3% | 49.6% | 50.7% | 50.3% | 16.3 |
| Wakefield | Yorkshire and the Humber | 11,653 | 45.4% | 46.7% | 46.6% | 40.1% | 13.3 |
| Wallasey | North West | 968 | 54.3% | 49.6% | 54.4% | 40.1% | 12.6 |
| Walton LGV | Yorkshire and the Humber | 1,894 | 59.8% | 56.9% | 63.7% | 46.7% | 10.3 |
| Wanstead (London) | London | 8,258 | 44.4% | 40.4% | 42.2% | 42.1% | 13.0 |
| Warrington | North West | 7,550 | 55.5% | 55.3% | 55.5% | 48.6% | 17.1 |
| Warwick (Wedgenock House) | West Midlands | 15,070 | 48.5% | 48.4% | 47.3% | 43.8% | 9.8 |
| Watford | East of England | 12,939 | 46.2% | 46.6% | 44.8% | 41.1% | 15.1 |
| Wednesbury | West Midlands | 7,508 | 35.0% | 36.4% | 31.5% | 30.2% | 13.1 |
| Wellingborough | East Midlands | 1,450 | 60.0% | 55.1% | 59.4% | 57.6% | 18.0 |
| West Didsbury (Manchester) | North West | 17,806 | 47.7% | 50.9% | 48.1% | 43.1% | 19.9 |
| West Wickham (London) | London | 12,249 | 51.6% | 50.9% | 52.3% | 50.8% | 6.0 |
| Weston-super-Mare | South West | 4,443 | 61.0% | 56.5% | 61.3% | 54.8% | 4.0 |
| Whitby | Yorkshire and the Humber | 557 | 56.7% | 65.1% | 56.0% | n/a | 15.0 |
| Wick | Scotland | 239 | 59.4% | 53.8% | 61.8% | n/a | 13.1 |
| Widnes | North West | 6,846 | 42.7% | 40.1% | 41.3% | 37.6% | 9.1 |
| Winchester | South East | 4,602 | 52.2% | 47.9% | 50.0% | 45.3% | 11.3 |
| Wolverhampton | West Midlands | 11,561 | 34.3% | 33.4% | 33.4% | 27.2% | 15.9 |
| Wood Green (London) | London | 11,379 | 46.8% | 46.8% | 47.0% | 45.8% | 11.8 |
| Worcester | West Midlands | 11,590 | 51.9% | 50.6% | 52.3% | 44.4% | 14.0 |
| Workington | North West | 2,998 | 61.9% | 48.3% | 63.3% | 51.0% | 7.8 |
| Worksop | East Midlands | 5,975 | 55.2% | 53.3% | 56.2% | 47.9% | 12.1 |
| Worthing | South East | 8,495 | 59.8% | 58.8% | 60.2% | 54.4% | 13.7 |
| Wrexham | Wales | 4,819 | 51.9% | 56.8% | 54.2% | 38.3% | 7.1 |
| Yeading (London) | London | 6,735 | 52.8% | 46.9% | 50.9% | 51.9% | 3.0 |
| Yeovil | South West | 7,493 | 63.4% | 59.7% | 64.1% | 57.2% | 13.1 |
| York | Yorkshire and the Humber | 9,416 | 54.4% | 51.3% | 54.7% | 49.9% | 16.3 |
How to read the table: Pass rate is the share of tests passed in 2025/26, and 2024/25 is the same figure for the year before. 1st attempt is the pass rate for learners taking their first practical test. Automatic is the pass rate in automatic cars. Wait is the median number of weeks between booking and taking a test, for tests taken in September 2026. An asterisk means fewer than 100 tests, so treat that rate with caution. n/a means DVSA did not publish a figure or there were fewer than 50 tests.
Why pass rates differ between test centres
The test is the same everywhere. Every DVSA examiner follows the same published guidance, known as DT1, and marks faults the same way. DVSA’s figures do not explain why one centre passes more people than another, but they do show some clear patterns.
Who takes the test there
Age makes a big difference. In 2025/26, 17-year-olds passed 63.5% of their tests, 18-year-olds 55.3%, 25-year-olds 48.6%, 30-year-olds 44.9% and 40-year-olds 40.7%. So a centre’s pass rate partly reflects who takes tests there, not only how difficult its roads are.
The type of car matters too. Automatic tests had a pass rate of 44.6%, compared with about 52.3% for all other tests (our calculation). Among centres with 1,000 or more tests, those where a bigger share of tests were in automatic cars tended to have slightly lower pass rates.
The local roads
Most of the lowest rates are at busy centres in large urban areas, such as Wolverhampton, Liverpool and Glasgow, while many of the highest are in smaller towns. DVSA’s data does not measure how demanding each test route is, so it cannot show how much of this gap comes from the roads themselves.
Rates are steady from year to year
A centre’s pass rate is a fairly good guide to next year’s. Of the 256 larger centres that also had results in 2024/25, 222 finished within 5 percentage points of their previous rate.
Waiting times do not predict pass rates
We compared each centre’s pass rate with its median waiting time in September 2026 and found no link. Centres with long waits were just as likely to have high pass rates as low ones.
Should you choose a test centre for its pass rate?
It is tempting to book the centre with the best figures, but there are good reasons to think twice:
- The 2026 booking rules. Since 9 June 2026, you can only move a car test to one of the 3 nearest centres to the one you booked, so choose carefully the first time. Our guide on how to book a driving test explains the new rules.
- Knowing the area. Practising on the roads around your test centre helps you deal with its junctions, roundabouts and speed limit changes. A far-away centre means learning new roads.
- Time and cost. If you take the test in your instructor’s car, travelling to a distant centre usually means paying for more lesson time on the day.
- The standard does not change. A high pass rate does not lower the bar for you. Your examiner marks your driving to the same standard as anywhere else, so being ready matters far more than where you test.
Wherever you take your test, the same mistakes cause most failures. DVSA’s list of the most common faults in 2025/26 was:
- Junctions: not observing properly
- Mirrors: not checking before changing direction
- Junctions: turning right
- Responding to traffic lights
- Steering control
- Moving off safely
- Responding to road markings
- Responding to traffic signs
- Positioning during normal driving
- Keeping up appropriate speed and progress
Our guides to how many minors you can have on a driving test and how many driving lessons you need explain how faults are marked and how to judge when you are ready.
What about Northern Ireland?
DVSA’s figures cover England, Scotland and Wales only. In Northern Ireland, driving tests are run by the Driver and Vehicle Agency (DVA), and car test pass rates by test centre are published separately as open data on OpenDataNI.
When are the figures updated?
DVSA updates its test centre pass rates once a year. The current figures were published in June 2026, and the next update is due in June 2027. National pass rates are updated every quarter, and waiting times for each centre every month. We will update this page when new figures come out.
Frequently asked questions
Which test centre has the highest pass rate?
Among centres with at least 1,000 car tests in 2025/26, Melton Mowbray had the highest pass rate at 69.7%, followed by Barrow-in-Furness (69.6%) and Dorchester (69.0%). The Isles of Scilly had a higher rate, 75.0%, but from only 8 tests.
Which area is easiest to pass a driving test?
By region, the South East had the highest pass rate in 2025/26 at 53.2%, followed by Wales (52.4%) and the South West (51.7%). The West Midlands was lowest at 46.2%. These are our calculations from DVSA’s test centre figures.
What are the top 10 hardest driving test centres?
Among open centres with at least 1,000 tests in 2025/26, the lowest pass rates were at Wolverhampton (34.3%), Wednesbury (35.0%), Dunfermline (Vine) (36.4%), Featherstone (36.4%), Gateshead (37.5%), Norris Green in Liverpool (37.8%), Luton (39.2%), Chingford (39.9%), Glasgow (Shieldhall) (39.9%) and Coventry (40.0%).
What is the average driving test pass rate?
The car driving test pass rate in Great Britain was 50.0% from April 2025 to March 2026. For April to June 2026 it was 51.3%.
Is it easier to pass in an automatic car?
No. Automatic car tests had a pass rate of 44.6% in 2025/26, lower than the overall rate of 50.0%.
Does a high pass rate mean the examiners are easier?
Not necessarily. All DVSA examiners follow the same guidance and marking system. Pass rates also depend on who takes tests at a centre, such as their age, and on the local roads.
Can I take my driving test at any test centre?
You choose the test centre when you book. Since 9 June 2026, if you change your car test you can only move it to one of the 3 nearest centres to the one you booked.
How often are test centre pass rates updated?
Once a year. DVSA published the 2025/26 figures in June 2026 and plans the next update for June 2027.
Sources: DVSA Car driving test data by test centre (tables DRT122A, DRT122C and DRT122E, April 2025 to March 2026, published June 2026; DRT122F waiting times to September 2026); DVSA Car driving test data for Great Britain (tables DRT121A to June 2026, DRT121C and DRT121F); GOV.UK Carrying out driving tests: examiner guidance (DT1); DVSA Changes to driving test booking rules in 2026; OpenDataNI Driver testing outcomes by test centre. Regional figures, the manual and automatic comparison, and the year-on-year and waiting time comparisons are RoadReadyHub calculations from DVSA data.